
pg_stat_activity on your iPhone
Activity is pg_stat_activity laid out for a phone: waiting sessions first, the longest ones next, every state and wait event readable at a glance, and the session that blocks the others marked as such.
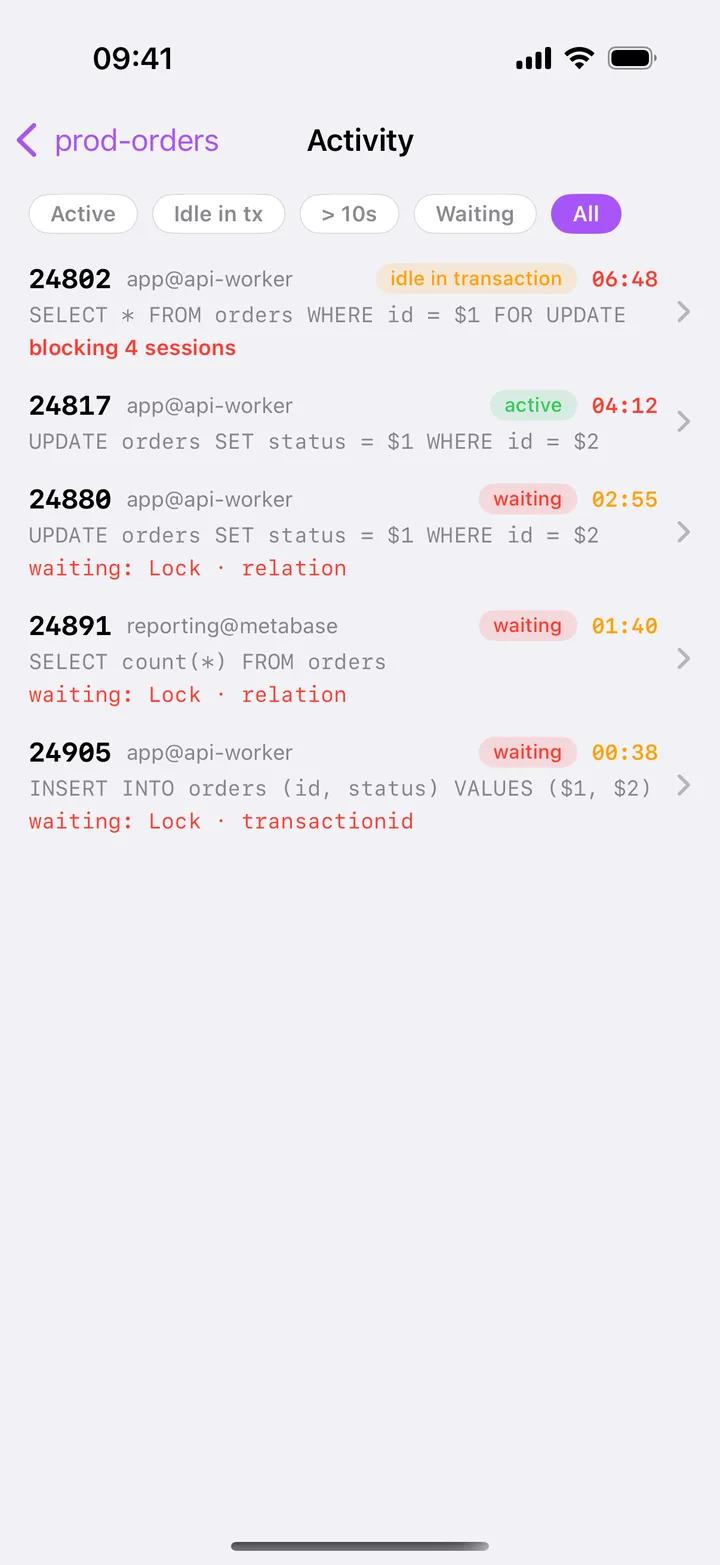
The query you would type, already sorted
On a laptop you would start with something like this:
SELECT pid, usename, application_name, state, wait_event_type, wait_event,
       now() - coalesce(xact_start, query_start) AS age,
       left(query, 80) AS query
FROM pg_stat_activity
WHERE backend_type = 'client backend'
ORDER BY age DESC NULLS LAST;
HeapDeck’s Activity screen reads the same view every 5 seconds while it is open and orders it the way you read it during an incident: active sessions that are waiting on something first, then everything else by duration.
What each row tells you
- the pid and
user@application, with· youon HeapDeck’s own session; - the state:
active,idle in transaction,idleorwaiting; - how long it has been in that state, timed the way that matters: from
query_startfor active sessions, from the start of the transaction foridle in transaction. The time turns amber at 10 seconds and red at 4 minutes; - the first line of its SQL;
- what it waits for, such as
waiting: Lock · relation, in red when it is a lock; blocking 4 sessionsin red on the session at the root of a lock chain.
Filters across the top narrow the list to Active, Idle in tx, > 10s or Waiting. Tap a row for the details: client address, when the current state started, the wait event and the full SQL with a copy button. If that session is itself waiting on another, the details say so, and that cancelling it won’t unblock the chain.
Cancel or terminate
Swipe a row left for Cancel and Terminate:
- Cancel sends
pg_cancel_backend(pid): the statement stops, the session stays. - Terminate sends
pg_terminate_backend(pid): the session ends and its open transaction rolls back. On a connection you marked as Production, you type the pid to confirm.
Both are part of HeapDeck Pro. HeapDeck’s own session has no actions.
Without pg_monitor
Without pg_monitor, PostgreSQL shows other users’ sessions but replaces their SQL with <insufficient privilege>. HeapDeck keeps the list, says You can see sessions, but not their SQL and shows the grant that fixes it:
GRANT pg_monitor TO monitoring_role;From a slow query to the sessions running it
On PostgreSQL 14 and later with compute_query_id on, a statement in Slow queries links to the sessions running it right now. Activity then refreshes that filter on the server every 5 seconds, so you see when the last copy of a bad query finishes.