
Postgres monitoring for a solo founder
You are the only one on call. A Postgres problem can reach you at dinner or on holiday. You can build this setup in an hour.
Updated · Vladimir Chemeris, the developer of HeapDeck

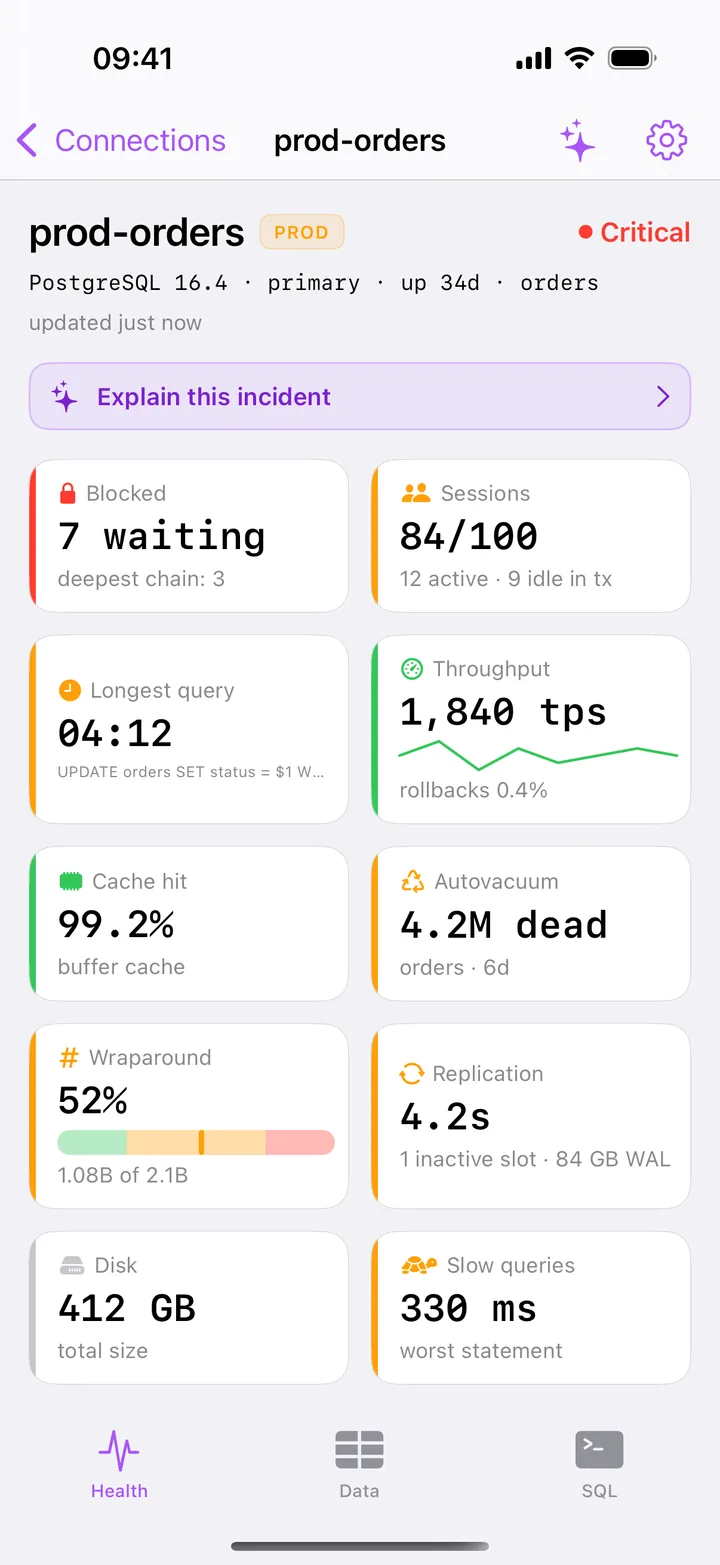
The setup, in an hour
1. An alert that reaches your phone. HeapDeck doesn’t send alerts, so something else has to wake you. An uptime check on an endpoint that touches the database will do, or your provider’s metric alerts.
2. HeapDeck, tested once. Connect it to production and run Test connection over cellular, away from your home network. Use a role with pg_monitor, and an SSH tunnel if the database is private.
3. Three settings for the common failures. Set these per application role, so your migrations and manual work keep their own limits:
ALTER ROLE app SET statement_timeout = '30s';
ALTER ROLE app SET idle_in_transaction_session_timeout = '2min';
The first stops a runaway query, and the second ends a transaction your code forgot about. Pick values above your slowest legitimate request. The third matters if you use replication slots or a CDC tool. It caps the WAL a dead slot can hold, so a forgotten connector can’t fill your disk:
ALTER SYSTEM SET max_slot_wal_keep_size = '20GB';
SELECT pg_reload_conf();
On a managed service, change that one in the provider’s settings.
Five minutes a week
Open HeapDeck once a week while nothing is wrong:
- Health: a green verdict, or the amber tile to read about.
- Wraparound: the percentage should stay low. Amber starts at 25%.
- Slow queries: sort by total time. A new statement at the top points to a recent deploy.
- Vacuum & Bloat: unused indexes, listed by size, and tables with many dead rows. HeapDeck copies
DROP INDEX CONCURRENTLYfor you and leaves running it to you. - Replication: any slot marked inactive.
When it goes wrong on a Saturday
| You see | Guide |
|---|---|
| The API times out, sessions wait | Find blocking queries |
| One query has run for minutes | Kill a stuck query |
sorry, too many clients already |
Free connections |
| The app feels slow, nothing obvious | Five checks, in order |
| The disk fills up | An inactive replication slot |
From the phone you contain the incident, and you do the proper fix later on your laptop.
What it costs
One server on Free covers monitoring: each screen, the table browser and read-only SQL, with no account. Stopping a session, running VACUUM and dropping a slot need Pro, one purchase of $19.99 with no subscription. You can try each action first in the built-in demo, on fictional data.
Questions
Is there a free Postgres monitor for iPhone?
Yes. HeapDeck is free for one saved server, with all the monitoring screens, the table browser and read-only SQL, and it needs no account. Pro adds more servers and the actions.
Will HeapDeck wake me up when Postgres goes down?
No. It has no push alerts and works only while open. Use an uptime checker or your provider's alerts for that, and open HeapDeck once they page you.
Do I need a monitoring stack for one small database?
Not on day one. An uptime check, your provider's metrics and a few minutes a week on HeapDeck's Health screen catch the failures that take down a small product. Add Grafana or a hosted tool when you need history and trends.
Grafana is a trademark of its owner. HeapDeck is not affiliated with or endorsed by its owner.