
Postgres monitoring tools compared by the job they do
An on-call setup for Postgres needs two kinds of tool: one that watches the server all day and wakes you, and one you open to act. HeapDeck is the second kind.
Updated · Vladimir Chemeris, the developer of HeapDeck

The tools, side by side
| Tool | Main job | Where it runs | Alerts and history | On a phone |
|---|---|---|---|---|
Grafana + postgres_exporter |
Metric dashboards and alerts | Self-hosted, or Grafana Cloud, with an exporter near the database | Yes | Grafana’s app: dashboards, push, acknowledge and escalate alerts (Grafana Cloud) |
| Datadog Database Monitoring | Query metrics, dashboards, alerts | Hosted, with an agent | Yes | Datadog’s app: alerts, monitors, dashboards, logs |
| pganalyze | Query performance and index advice | Hosted, with a collector | Yes, alerts through Slack or PagerDuty | Web pages |
| PgHero | Performance dashboard | Self-hosted, Docker or Rails | A live dashboard | Web pages |
| pgAdmin | Admin GUI and query tool | Desktop, or a web app on your server | A live dashboard | No iOS app; a browser if you host it |
psql over SSH |
Anything SQL can do | Your terminal, your bastion | None | An SSH app, and you type the SQL |
| HeapDeck | Incident screens with actions | iPhone and iPad, direct or through SSH | None | Native screens built for this |
Tools that watch, and tools you open
The first group runs all day. It samples metrics, keeps history, draws trends and pages you. You need one of these if anyone depends on your database. The mobile apps from Grafana and Datadog extend that job to your phone: you see the alert, read the dashboard, acknowledge and escalate.
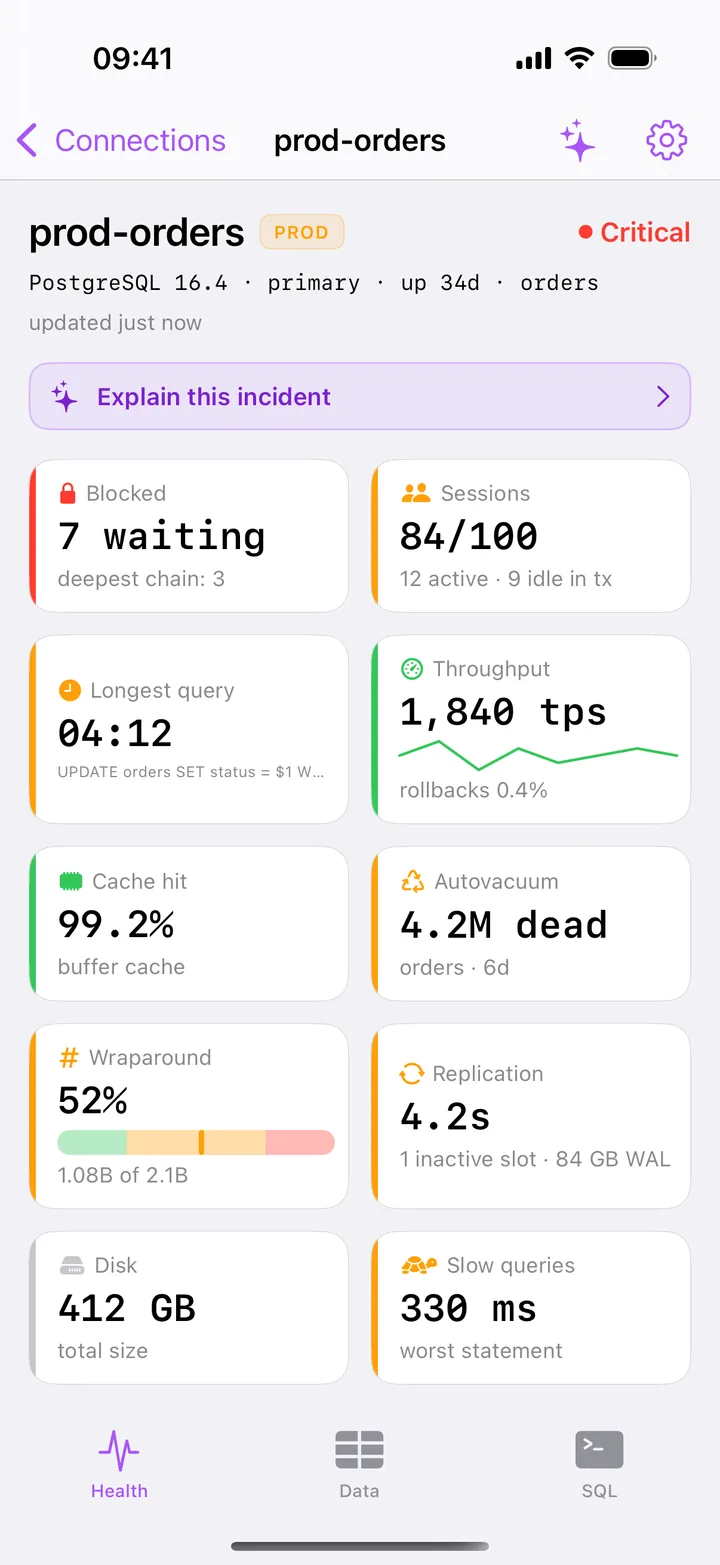
After the alert you still need a session on the database, which on a normal day means your laptop and psql. HeapDeck covers that step from the phone: it connects to PostgreSQL, shows sessions, locks, slots and vacuum state as they are now, and sends the signal after you confirm.
Keep the alerting you have, and add HeapDeck for the times you get paged without a laptop.
HeapDeck compared with psql over SSH
psql over SSH can do all of it, and you don’t have to trust a new app to get started. On a phone keyboard, though, you type a join across pg_stat_activity and pg_blocking_pids() by memory, read wrapped output on a 6-inch screen, and paste a pid by hand.
psql over SSH |
HeapDeck | |
|---|---|---|
| Find the root blocker | Write the query, walk the chain yourself | Tree with the root on top, refreshed every 5 seconds |
| Stop a session | Type the pid | Swipe, with a preview of what it frees |
| Stale data | Your last output | Reads the chain again before it signals |
| A slip of the finger | Runs what you typed | Classifier, confirmation, typed name for destructive steps |
| Limits | None beyond SQL and your role | One statement at a time, up to 500 rows in the console |
Choose psql for multi-statement scripts, \d and COPY work, server files and logs. It needs no install on the server side, and neither does HeapDeck.
HeapDeck compared with pgAdmin
pgAdmin is the standard free admin tool for PostgreSQL: query tool, schema browser, backups, and a dashboard of server activity. The project’s download page lists container, macOS, Python, APT, RPM, source and Windows builds, with no iOS or Android app. You can run it in server mode and open it in a phone browser, which means hosting a web app that can reach your database.
Keep pgAdmin for desktop admin work. HeapDeck has a narrower job: the screens you need during an incident, on a phone, with no server to host. If you were looking for a pgAdmin for iPhone, see Postgres apps for iPhone compared.
Pick by what you need
- You need to get woken up: Grafana with
postgres_exporter, Datadog, pganalyze, or your provider’s alerts. - You want trends and query history: pganalyze or Datadog.
- You run one small database: an uptime check and HeapDeck on Free. See the solo founder setup.
- You get paged without a laptop: HeapDeck. See on call without the laptop.
- You have no DBA and no superuser: see monitoring without a DBA.
Where HeapDeck falls short
HeapDeck has no alerts, background checks or metric history, and it shows nothing outside PostgreSQL’s own views: no CPU, no free disk, no server logs. It runs on iPhone and iPad only, and it has no mTLS or Kerberos. If you need any of those on your phone, the tools above are a better fit.
Questions
What is the best Postgres monitoring tool?
It depends on the job. For alerts and long-term graphs, pick Grafana with postgres_exporter or a hosted tool such as Datadog or pganalyze. For query-level advice, pick pganalyze. To see and stop an incident from an iPhone, pick HeapDeck. A team on call needs one of the first group and can add the last.
Are there free Postgres monitoring tools?
Yes. Grafana OSS with postgres_exporter and PgHero are open source, and you host them yourself. pgAdmin is free too. HeapDeck is free on iPhone and iPad for one server, with Pro as a one-time purchase.
Can HeapDeck replace Datadog or Grafana?
No. HeapDeck keeps no history and sends no alerts, and it only sees PostgreSQL's own views. Keep those tools. HeapDeck adds a phone screen where you stop the session behind the alert.
Why use HeapDeck when I can SSH in and run psql?
You can, and HeapDeck runs the same SQL. It saves you typing joins on a phone keyboard at 3 a.m., and it re-reads a lock chain before it signals anything. Keep psql for what a screen doesn't cover.
Grafana, Datadog, pganalyze, PgHero, pgAdmin, PagerDuty and Slack are trademarks or names of their respective owners. HeapDeck is not affiliated with or endorsed by any of them. Details of third-party tools come from their own sites and App Store listings as of November 1, 2026.