
Why is my Postgres slow? Five checks, in order
You can do the first five minutes without a DBA. Each check takes seconds, and the early ones rule out the causes that need action right now.
Updated · Vladimir Chemeris, the developer of HeapDeck

1. Are sessions waiting on a lock?
Lock waits come first because they get worse each second, and stopping one session can clear them.
SELECT count(*) AS waiting
FROM pg_stat_activity
WHERE wait_event_type = 'Lock';
More than a handful means you have a chain. Find the session at its root: blocking queries, step by step. A migration waiting for a lock is a common source: one ALTER TABLE can block every query on a table.
2. Is one query running for minutes?
SELECT pid, usename, now() - query_start AS running_for, left(query, 80) AS query
FROM pg_stat_activity
WHERE state = 'active' AND pid <> pg_backend_pid()
ORDER BY running_for DESC NULLS LAST
LIMIT 10;
A report or a forgotten script can hold a CPU core and a lot of I/O for as long as it runs. If you decide to stop it, read cancel or terminate first.
3. Are connections near the limit?
SELECT count(*) AS sessions,
       current_setting('max_connections') AS max_connections
FROM pg_stat_activity
WHERE backend_type = 'client backend';
Near the limit, new requests wait for a slot or fail. Too many clients already covers how to free them.
4. Did the cache hit rate drop?
SELECT round(100.0 * sum(blks_hit) / nullif(sum(blks_hit) + sum(blks_read), 0), 1) AS cache_hit_pct
FROM pg_stat_database;
This counts since the last statistics reset, so compare it with the same query a minute later. A drop means queries read from disk: a cold cache after a restart, a scan larger than memory, or a working set that outgrew shared_buffers.
5. Which statements cost the most?
Use pg_stat_statements. It needs shared_preload_libraries = 'pg_stat_statements', a restart and CREATE EXTENSION pg_stat_statements;. On RDS you enable the library in the parameter group, and Supabase has it on.
SELECT calls,
       round(total_exec_time)              AS total_ms,
       round(mean_exec_time::numeric, 1)   AS mean_ms,
       rows,
       left(query, 80)                     AS query
FROM pg_stat_statements
ORDER BY total_exec_time DESC
LIMIT 20;
Sort by total_exec_time for what loads the server, by mean_exec_time for what a single user waits on, and by calls for an N+1 pattern. These numbers accumulate since the last reset, so a query that turned slow ten minutes ago can still rank low.
Take the top statement and run it through EXPLAIN. EXPLAIN (ANALYZE, BUFFERS) runs the query, so watch out with writes and with anything slow during an incident.
If none of these explain it
- Dead rows and stale statistics. Check
n_dead_tupandlast_autoanalyzeinpg_stat_user_tables. See autovacuum and wraparound. - A lagging replica. If reads go to a standby, see replication lag.
- The machine itself. CPU, disk I/O and memory pressure live outside PostgreSQL’s views. Check your host or provider’s dashboard.
On the phone
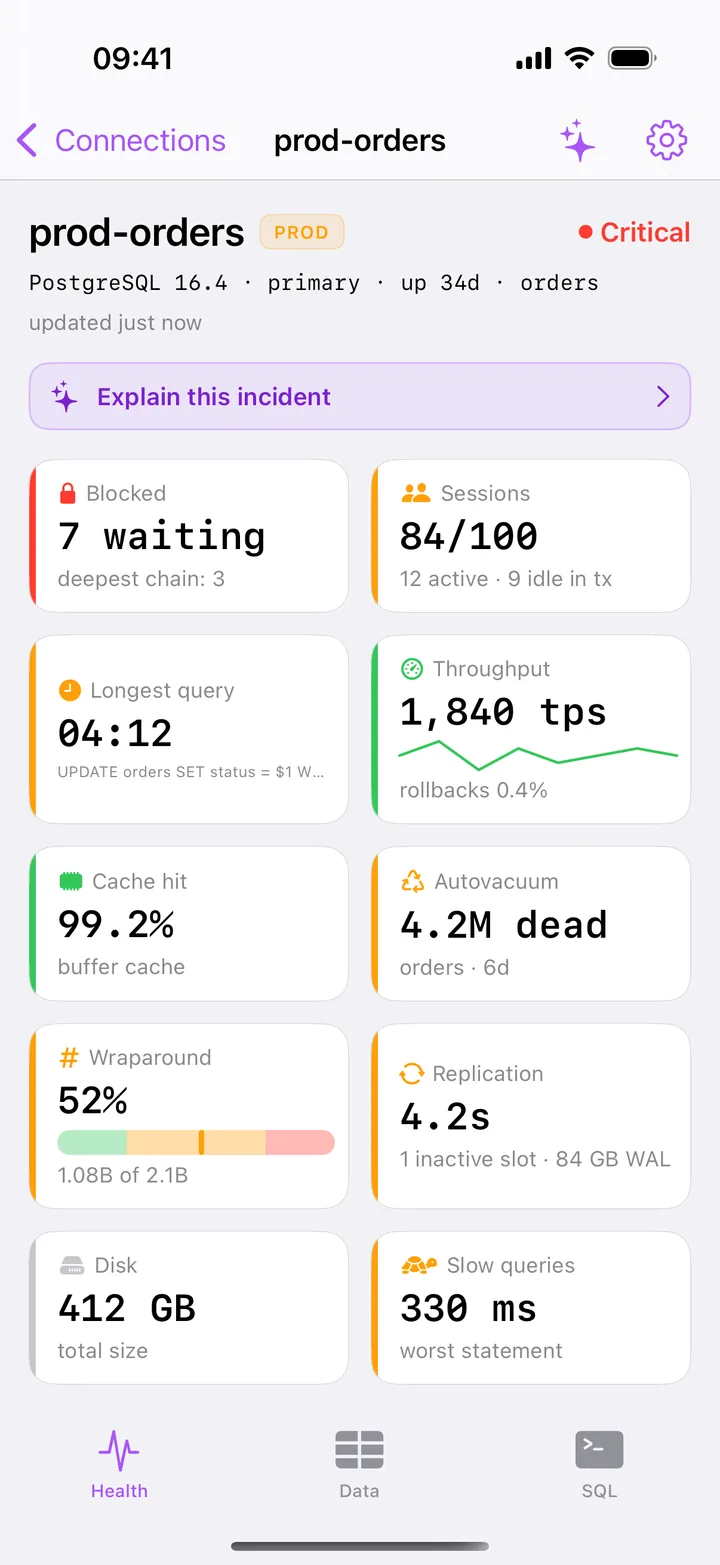
HeapDeck’s Health screen puts the five checks on one screen, with a verdict on top and a line naming the tiles behind it:
| Check | Tile | Amber | Red |
|---|---|---|---|
| Lock waits | Blocked | any waiting | 3 waiting, or a chain of 3 |
| Long queries | Longest query | 1 minute | 5 minutes |
| Connections | Sessions | 70% of max_connections |
90% |
| Cache | Cache hit | below 95% | below 80% |
| Expensive statements | Slow queries | no rating | no rating |
Slow queries carries no color because its worst mean describes the past. Tap it for the 300 heaviest statements, sorted by total time, mean, calls or rows. A statement’s detail shows its role, database, timings and I/O, and on PostgreSQL 14 and later the sessions running it now. Copy SQL gives you the text to paste into the console, where EXPLAIN and EXPLAIN ANALYZE of a SELECT run as reads. On Free, reads run inside BEGIN READ ONLY … ROLLBACK.
All of this is free for one saved server. Stopping a session is part of HeapDeck Pro.
Questions
How do I find slow queries in Postgres?
Use the pg_stat_statements extension. It records calls, total time, mean time and rows per normalized statement. Sort by total_exec_time to find the load on the server, and by mean_exec_time to find what a user feels. The numbers accumulate since the last reset.
How do I see slow queries on Supabase or Amazon RDS?
Supabase has pg_stat_statements enabled. On Amazon RDS, you enable the library in the parameter group. HeapDeck's Slow queries screen reads the same extension over any connection, and says so when it is missing.
Why does Postgres use so much CPU?
PostgreSQL doesn't report CPU use in SQL, so read the percentage on your host or provider's dashboard. To find the cause, count active sessions in pg_stat_activity and sort pg_stat_statements by total time. HeapDeck shows both and shows no CPU figure.
What is a good Postgres cache hit ratio?
Transactional workloads tend to sit above 99%. HeapDeck's tile turns amber below 95% and red below 80%, measured between two reads. A cold cache after a restart lowers it for a while, as does a large scan.
Amazon Web Services, AWS and Amazon RDS are trademarks of Amazon.com, Inc. or its affiliates. Supabase is a trademark of its owner. HeapDeck is not affiliated with or endorsed by either of them.